What the New Bike Counters on Spruce and Pine Tell Us
In November 2020, DVRPC and the Philadelphia’s Office of Transportation, Infrastructure, and Sustainability (oTIS) and the Streets Department completed the installation of in-street permanent bicycle counters on Spruce and Pine streets. Located near where the streets intersect 12th Street, these permanent counters fill critical data gaps that arose when planners relied on the week-long counts conducted every few years. The counters run 24/7, 365 days a year, allowing for long-term and consistent data collection and analysis.
Previous reporting has shown increases in bicycling on regional trails in the time of COVID, but new count data from these permanent counters suggests a similar finding on bicycle lanes in Center City Philadelphia.
click to view larger image
×
The graph above shows total cyclists using the Schuylkill Banks portion of the Schuylkill River Trail (SRT) in red, and the total cyclists using the Spruce and Pine street bicycle lanes in blue from late November to the end of February. SRT trail volumes and peaks were higher from November to late January, at which point Spruce and Pine Street volumes overtook the SRT.
On February 15th, the SRT closed at Chestnut Street for three months of construction, which may have reduced trail use near the permanent counter. The counter is located one block south of Chestnut Street. However, it is clear that before this date, trail volumes were lower when compared to Spruce and Pine streets. This could be explained by the seasonality of recreational riders on the SRT versus the consistency of bicycle commuters and utilitarian riders using the Center City bike lanes.
To analyze bicycle commute trends during COVID, hourly data was analyzed for Spruce and Pine streets. The graph below shows the average number of cyclists per hour passing by the permanent bicycle counters from November 2020 to February 2021. Historic data from 2011 Spruce Street counts was also averaged to provide context and comparison (data for Pine Street from this time period is not available). A limitation of the week-long counts versus the permanent counts is that the Spruce Street historic data shown here only represents average cyclists for a one-week period, while the Spruce and Pine data represents averages over a three-month period. When compared to 2011 data, bike lane usage peaked earlier in the day in 2020-2021.
click to view larger image
×
Permanent bicycle counters allow planners and policymakers to better understand how various factors influence cycling. The 24/7/365 nature of the counters also allows greater certainty of how many people are actually using a facility. The counters have provided valuable data regarding commuting during COVID, and the data they produce can inform policy and plans to strengthen the region’s recovery after the pandemic. For instance, hourly data could inform a plan of targeted enforcement of “no parking in the bike lane” rules to the hours when the bike lanes are used the most.
December 2020 Philadelphia Pedestrian Counts
To say it’s been an eventful year is an understatement! And we can see these ups and downs translate into different patterns of pedestrian activity across the city and are reflected in our ongoing travel monitoring efforts with our partners.
The bar chart below shows pedestrian counts from March 1st to November 30th, 2020 at 3rd and Market street (in red) and 40th and Lancaster streets (in blue). Important dates and events are highlighted as they help explain some of the peaks and valleys in the chart. In Old City, the highest number of pedestrians (5,810) was counted on November 7th, the day the election was called. People were celebrating the democratic process in the very birthplace of our democracy! Levels of walking at 40th and Lancaster stayed surprisingly consistent throughout the year, which is probably reflective of the fact that it's a hub of neighborhood activity and access to transit. It is less impacted by changes in tourism and restaurant and nightlife activity, compared to Old City.
The counter at 3rd and Market is owned by Old City District. The counter at 40th and Lancaster is owned by the Philadelphia Health Department. Both agencies allow DVRPC access to their data for monitoring and analysis. Thanks to both for their sharing and collaboration!
June 2020 Trail Counts
Regional Trails are Realizing a Boom in Pedestrian Activity
A recent cycling boom nationwide has stirred much media attention. DVRPC’s previous regional analysis over the past few months has confirmed this trend. But a comparison of trail count data from March-June 2019 and 2020 shows a similar boom in pedestrian trail activity.
From March through June 2020, pedestrians have considerably increased their trail usage compared to 2019. The graph below highlights both pedestrian and bicycle increases this year. Pedestrian use is a big part of the increase in trail use this year. The Delaware River Trail at Port Richmond saw 7,000 new pedestrians in 2020, while the Wissahickon trail saw 24,000 additional pedestrians. The Chester Valley Trail gained just over 34,000 pedestrian trail users from 2019, nearly doubling pedestrian trail use. Schuylkill Banks saw an additional 50,000 pedestrian trail users.
All five automated trail counters measured an increase in pedestrian traffic analogous with the regional increase in cycling. In 2020, pedestrian and bicyclist counts surpassed the previous year’s counts on all five trails identified in the above table. The Chester Valley Trail and the Delaware River Trail at Port Richmond, saw a shift in the most common trail users with pedestrians becoming more common in 2020 than cyclists.
While we’re seeing an increase in trail use within the region, we’re also seeing a more pronounced period of use throughout the day, concentrating in the late afternoon. The graphs below offer a snapshot of hourly weekday usage averaged across March-June, 2019 and 2020 on the Port Richmond trail. In 2020, there is a peak in users between 4 and 7 PM, with softer pedestrian “spikes” at 6 AM and 12 PM than in 2019. Overall, compared to 2019, usage has increased the most dramatically in the late afternoon to evening. This information is consistent with more people working from home and using trails after the work day, for recreation, than for more traditional bicycle commute times.
Previous analysis has shown a cycling boom, but this increase has also been mirrored by a substantial pedestrian increase on regional trails. Explore DVRPC's Permanent Bicycle and Pedestrian Count web page for more details!
May 2020 Trail Counts
Regional Trail Use Continues to be Up From Last Year
DVRPC's permanent trail count data from May 2020 shows yet another month of increased trail use in the region from 2019. DVRPC has monitored trail use during the pandemic, recently reporting on trail increases in both March and April of this year compared to last year. In fact, data shows it's been up since January 2020. The following graphic shows this uptick from 2019 to 2020 of bicycle and pedestrian trail use on four trails in the region: Chester Valley Trail, Delaware River Trail at Port Richmond, Schuylkill River Trail at Spring Mill and Wissahickon Trail.
In May, trail use was up slightly over the three-day Memorial Day weekend, despite this year's stormy Saturday. Combined data from the Schuylkill Banks, Chester Valley Trail, Washington Crossing, Port Richmond, and the Wissahickon counters show usage up during the three days by 9%. Sunday showed the biggest increase in use on the trails with usage up 52% from 2019.
As we’ve previously reported, trail use on typically less used trails is realizing significant increases. Over the Memorial Day holiday weekend for example, the Delaware River trail at Port Richmond trail saw a 132% in use over the weekend. Washington Crossing saw a 9% increase over the three-day weekend with a 68% increase on Sunday alone.
Regional Trail Use Continues to be Up From Last Year
Spring 2020 trail use continues to be high. Last month,
DVRPC shared
the spike in trail use we saw in March using data from our
permanent trail counters.
April data looks the same: trail use continues to be higher on most trails compared to 2019 despite worse weather. April 2019 had roughly the same amount of rainy days (5 versus 4), but twice as many days over 60 degrees (26 versus 13). Each month had 8 weekend days, typically the highest use days.
Despite last year's better weather, two of the region's traditionally more lightly trafficked trails, the D&L at Washington Crossing and the US 202 Parkway trail, saw large percentage increases (118% and 138% respectively). The Schuylkill Banks trail, the region's most heavily trafficked trail segment, actually saw an 18% drop in use. This drop could be due in part to the weather, but the continued high use of other trails suggests users may be seeking out more lightly trafficked trails in order to maintain physical distance.
A shift in the time of day cyclists are using our trails is also occurring. As more of our region's workforce works from home rather than commuting to their workplace, usage has shifted away from the double peak "rush hours" more typical on trails used for commuting to a single "recreational" peak in the afternoon. Wissahickon trail weekday bicycle data illustrates that the April 2019 bicycle "rush hour" peaks at the beginning and end of the workday shifted in April 2020 to a single, late afternoon peak profile, more typical of recreational users.
As we celebrate Bike Month this May, continue to stay safe. Follow national guidance on physical distancing such as wearing a mask and maintaining a physical distance of at least 6' from others. Consider going on a ride in the morning instead of the afternoon, and go the extra mile by waiting to pass, signalling your approach, and maintaining a single file in some locations.
Explore DVRPC's Permanent Bicycle and Pedestrian Count web page for more details!
DVRPC counts bicyclists and pedestrians because count data helps us understand and plan for the role bicyclists and pedestrians play in our transportation network. Similar to how planners use vehicular traffic counts to analyze roadway facilities, our bicycle and pedestrian counting program allows planners to measure existing levels of bicycling and walking, monitor travel trends, plan for new or improved facilities and measure outcomes of bicycle and pedestrian related projects. Our counting program consists of four types of counts: Project Counts, Cyclical Counts, Screenline Counts and Permanent Counts.
Type of Counts
Project Counts
Project counts are bicycle and pedestrian counts that aim to tell planners, engineers and stakeholders how much bicycle and/or pedestrian activity exists in an area (intersection, corridor, etc.). If taken in the same location at different times, for instance, before or after a bike lane is striped, these counts can measure the effect on bicycling or walking.Typically DVRPC counts in locations where we, or our partners, are doing planning, engineering, or public engagement work along a corridor or site. Counts are typically conducted with pneumatic tubes or infrared devices for seven days to capture the variation across the week. For counts taken by video, a shorter time period may be required.
Cyclical Counts
DVRPC's cyclical pedestrian and bicycle programs conduct counts at the same location at regular intervals, on an ongoing basis. Locations were selected to represent a range of facility and land use types across our region. DVRPC's cyclical bicycle program has about 90 locations in PA and about 60 in New Jersey. Our cyclical pedestrian program has 170 locations in Pennsylvania only. Each program started with a "saturation" year or base year where each location was counted. Subsequently, each location is counted again, on a three-year cycle. The representative sampling of locations, taken over regular intervals, allows for measuring trends across land use, facility type, and by location.
Screenline and Cordon Counts
Screenline and Cordon Counts: These are five year cyclical counts taken on roads that cross the border of the DVRPC region, cross the Delaware and Schuylkill rivers, and that cross over county boundaries. Counts are also taken on roads that cross the border for the Philadelphia Center City District. These counts are used to compare and create travel trends in the region used in our model.
Permanent Counts
DVRPC also collects data from trail use counters located on Circuit Trails throughout the region. This data records trail use by direction and by mode (walking vs. bicycling) continuously throughout the course of a year. Trends in trail use can be analyzed since the inception of the program in 2008. Permanent counts also allow staff to develop seasonal adjustment factors which can be applied to project and cyclical counts to get the annual average daily bicycle or pedestrian count. The William Penn Foundation, Pennsylvania Environmental Council, and Schuylkill River Development Corporation provided generous support for the acquisition and installation of the counters.
How Do We Count?
DVRPC owns, installs and maintains its own counting equipment. Our pedestrian counts are taken using ECO Counter pedestrian counters. Our bicycle counts are taken using ECO Counter pneumatic tube counters.
Where Does DVRPC Count?
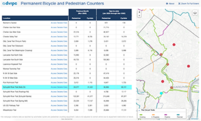
All over the region! Our Bicycle and Pedestrian Travel Monitoring Page shows all of the counts we take. To search for a location, start by typing in the name of a municipality or a zip code to see a count to see if one's been done there. If you don't see the counts you're looking for, contact Joshua Rocks at jrocks@dvrpc.org to discuss options.
Who Gets Counts and How Can I Request a Count?
Most DVRPC counts are taken with funds from our Annual Work Program with locations that are selected by DVRPC's partners and staff. Counts are requested by DVRPC project managers and by our Counties for various purposes and projects. Depending on DVRPC capacity, a small amount of counts can be taken for a fee if requested.
Glossary of Bicycle and Pedestrian Counting Terminology
Average Daily Counts
Average Daily Bicycle (AADB) or Pedestrian (AADP) volumes are calculated by summing each factored daily count and then dividing by the number of full days in the count (usually 7 days). To get the Annual Average Daily Bicyclists or Pedestrians, seasonal factors are applied to the raw count data available.
Seasonal Adjustment Factors for Bicyclists
DVRPC's permanent counters provide yearlong data through documented weather conditions, seasonal and weekday variations. By analyzing this data for recurring changes associated with the calendar day over multiple years, DVRPC can measure the percentage amount that on average, a count is above or below normal. These seasonal adjustment factors are calculated for each day of the week within each month and range from .763 to 1.4. Daily totals from the observed count are multiplied by a seasonal adjustment factor and an equipment factor (provided by the manufacturer) and result in the Annual Average Daily Bicycles (AADB). An equipment factor attempts to correct for the average amount the equipment undercounts or misses users.
For example: If a bicycle count on a Monday in March is 500 with a seasonal factor of .95 taken on ECO Counter equipment that has a 1.1 equipment factor then the corrected total or AADB, is 522 (500 * .95 * 1.1).
Seasonal Adjustment Factors for Pedestrians
Annual Average Daily Pedestrians (AADP) volumes are calculated similar to bicyclists but since we don't yet have the recurring data for pedestrians associated with the calendar day over multiple years, we use factors from vehicular traffic on roadways. These vehicular traffic factors take into account route type, month of the year, and day of the week. Once the raw pedestrian count is multiplied by the roadway factor and equipment factor, all factored days are summed and averaged for the Average Daily Pedestrian count.
Disclaimer
While every effort is made on the part of DVRPC to provide valid and current information, DVRPC makes no representation, no warranties, express or implied, about the validity of this information and is not to be held responsible for errors in data obtained from this website.